Tuesday, June 17, 2014

Solving the Wrong Problem


For the last 100 years or so statisticians and econometricians have spent all of their energy solving the wrong statistical problem.

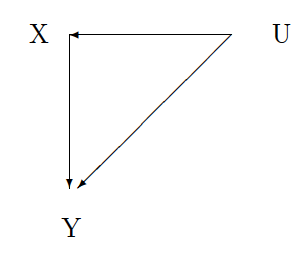
In statistics we are interested in determining what happens to some outcome of interest (Y) after making a change to some other observable variable (X).  For example, we are interested in increasing survival from colon cancer (Y to Y') using some new drug treatment (X to X').  The problem is there is some unobservable characteristic of the patient or the drug or both (U) that may determine both patient survival and the use of the new drug treatment.

There are two statistical problems.  

The first one, the one we spend all our energy on, is called "confounding."  In the picture above this problem is represented by the line running from U to X.  The unobserved characteristic of the patient is determining the treatment the patient receives.  In this paper, there seems to be a tendency for oxaliplatin to be given to healthier patients which may explain the survival difference between the oxaliplatin group and the non-oxaliplatin group.  To solve this problem we spend millions and millions of dollars every year to run randomized control trials.  In economics, we devise fancy and clever ways of overcoming the confounding with instrumental variables.

The second problem doesn't really have a name.  I will call it "mediating."  This problem is represented in the picture by the line from U to Y.  The problem is that there may be some unobserved characteristic of the patient that is mediating the effect of the treatment on the patient's survival.  Oxaliplatin may have greater effect on survival for younger patients relative to older patients (see here).  We do not spend any money or much time devising ways to solve this problem.  In fact, we often give up before we start by saying that it is impossible because it is not possible to observe the same patient's outcome under two different treatments.


The problem with spending all our time on the first problem is that once we solve it we are still no closer to solving the second problem and we still don't know what will happen to any patient when given the treatment being studied.

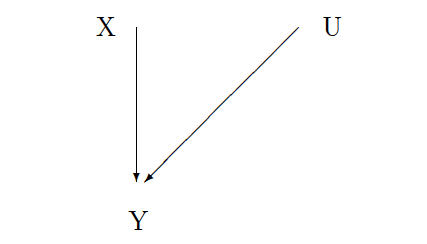
In the graph to the left, the outcome (Y) is a function of both the treatment (X) and the unobserved patient characteristic (U).  Although the experiment removes the line between U and X, the line between U and Y remains.

We can conduct as many experiments as we like and still be no closer to knowing what will happen when we give the treatment to a new patient because we don't know anything about that patient's unobserved characteristics.

Saturday, June 14, 2014

I Love Polynomials

The statistician, Andrew Gelman, hates polynomials.  I love them.

Polynomials are really very cool and they have a lot of very nice properties.

One of the most important properties they have in statistics is that they form a "ring".  This is an algebraic term meaning that any two elements of the set may be added (subtracted) or multiplied (divided) and the corresponding outcome is also an element of the set.  Fractions form a ring.  If you take any fraction and multiply it by any other fraction you get a fraction (a rational number).  Numbers (natural numbers) do not form a ring.  5/4 is not a natural number.

What is the big deal about rings?

The big deal is that if we have a set of continuous functions on a closed and bounded space that form a ring, then that set can approximate any (that is any and all) continuous functions on the aforementioned space.  In English.   If we want to approximate a continuous function, then we can't do any better than to use a polynomial.  For those interested, check out Stone-Weierstrass Theorem.

Polynomials are also unbelievably easy to estimate.  We can just do ordinary least squares regression and viola.

So any function you want to estimate can be approximated with a polynomial and they are really easy to estimate.  What is not to love?

How do you know that the polynomial you are estimating is really equal to the function you are interested in approximating?  Well.  You don't.

Gelman points out that there is a tendency to estimate very high order polynomials and he discusses the implications in this unpublished working paper.  The problem is that the data may not allow such polynomials to be identified.  The result is that many important coefficient estimates are simply made up numbers.  

I show in this paper that if you have a sequence of polynomials and a data set with enough information to accurately each polynomial in the sequence, then that sequence converges to the function of interest.  I also show in a Monte Carlo (with made up numbers) experiment that if there is not enough information in the data to accurately estimate a high order polynomial, the approximation error is very large.

The corollary is that if you have a polynomial that is a poor approximation of the function of interest then there is not enough information in the data to accurately estimate the high order polynomial.

Sunday, June 8, 2014

RCTs are Like Looking for Money Under the Street Light

Mutt and Jeff (June 3 1942)
Rubin (1974) argues that we should prefer randomized control trials (RCT) to observational data because the "casual effect" of the treatment is measured from the RCT data under mild assumptions. 

Rubin defines the "causal effect" of a new treatment as the difference between the outcome of the patient when she is given the new treatment and the outcome of the patient if she had received the current standard of care.  Rubin acknowledges that the difference is not observed and is in fact unobservable.  A patient can only ever receive one treatment and so it is not possible to observe the outcome in two alternative treatments.

Like the man in the top hat, Rubin suggests looking for the information in the light.  In Rubin's case the "light" is provided by the RCT which measures the average treatment effect under mild assumptions.  Rubin argues that average treatment effect is a measure of the difference in outcomes for the "typical" patient.  If we take "typical" to mean that it is true for some reasonable sized group of patients, then there is no reason to believe that the "typical treatment effect" will even have the same sign as the average treatment effect.  The average treatment effect averages over the difference in outcomes for each of the patients.  If some patients benefit from the treatment and some patients are harmed by the treatment then the average treatment effect may be positive or negative depending on the relative sizes of the two patient groups and the relative sizes of the benefits or harms.

If the average treatment effect is positive then we know for certain that there exists one patient for whom the new treatment was better than the existing treatment.  That is it.  That is all we know for certain.  It may be that all patients are better off with new treatment or it may be that (almost) all patients are worse off with the new treatment.  The average treatment effect is observed by the light of the RCT but it tells us very little about what we are looking for.